Cerbi / Application logging governance

Better logs start
in the development cycle.

Logging standards. Developer feedback. Runtime governance.

Bring logging standards into everyday engineering with IDE feedback, CI checks, and runtime governance. Give developers useful feedback and give the business shared visibility into how those standards are being applied.

Define. Check. Govern. Improve.

Control before propagation. / Editorial material studyExplore the development cycle

Logging standards / Everyday engineering

Improve logging
with every iteration.

Define the context your logs need and the fields they should exclude. Bring required and forbidden logging standards into IDE feedback, CI checks, and runtime governance on supported logging paths.

Built into your development cycle
Built into your development cycleOpen full-size diagram (new tab)
Read the diagram, step by step
  1. Plan the logging standards.
  2. Develop with IDE feedback.
  3. Build with CI checks.
  4. Run with runtime governance on supported logging paths.
  5. Review findings and trends.
  6. Improve the next sprint, then return to planning.

Application logs continue to your observability and data pipelines. Separately, Cerbi reports governance rules, recorded outcomes, trends, and tagged Relax usage. The normal reporting path excludes application payload; evidence and debug behavior depend on configuration. Relax can allow forbidden fields downstream. Developers, security, data, AI, and leadership teams use the resulting feedback and visibility.

Your team owns the next change.

Use findings to identify missing context or forbidden fields, then bring that evidence into your team's review, sprint, or backlog. Engineers and security decide what to change in logging code or policy, test the change, and review the next results.

Keep your engineering process.

The loop fits Scrum, Kanban, or your existing workflow. AI assistance can support the team where you use it. Cerbi supplies checks and evidence; your team owns decisions and delivery.

Improve logging with every iteration
Improve logging with every iterationOpen full-size diagram (new tab)
Read the diagram, step by step
  1. Define a standard: require correlationId and service; forbid password.
  2. Observe findings: missing context or a forbidden field.
  3. Review with engineers and security, with AI assistance where your team uses it.
  4. Plan a sprint or backlog fix to logging code or policy.
  5. Test and deploy with IDE and CI checks, plus runtime governance.
  6. Compare coverage and violations, then choose the next iteration.

Illustrative source fix: keep service as checkout, add correlationId trace-123, and omit password in the logging code. No real payload or secrets are shown. Consistent fields and required context support debugging, correlation, and downstream analytics. Cerbi supplies checks and evidence; your team owns the decisions, changes, and delivery.

Useful output. Clear governance evidence.

Application logs / Your destinations

Governed application logs continue to your configured observability and data pipelines, including downstream analytics. Consistent structured fields and required context help with debugging, correlation, and analysis.

Governance metadata / Cerbi dashboard

Separately, review rules, recorded outcomes, trends, and Relax usage in Cerbi. This governance reporting path is distinct from your application log destinations. Evidence and coverage depend on the integration, policy, and reporting configuration.

Inside CerbiShield / From observation to action

See what happened.
Know what to review.

A clear view of application risk, recorded policy outcomes and retained evidence. Built to help teams ask better questions of their logging controls.

Explore the dashboard

01 / Command Center

Know where to look.

Bring recorded outcomes, application risk and policy relationships into one review. Give the next investigation a clear starting point.
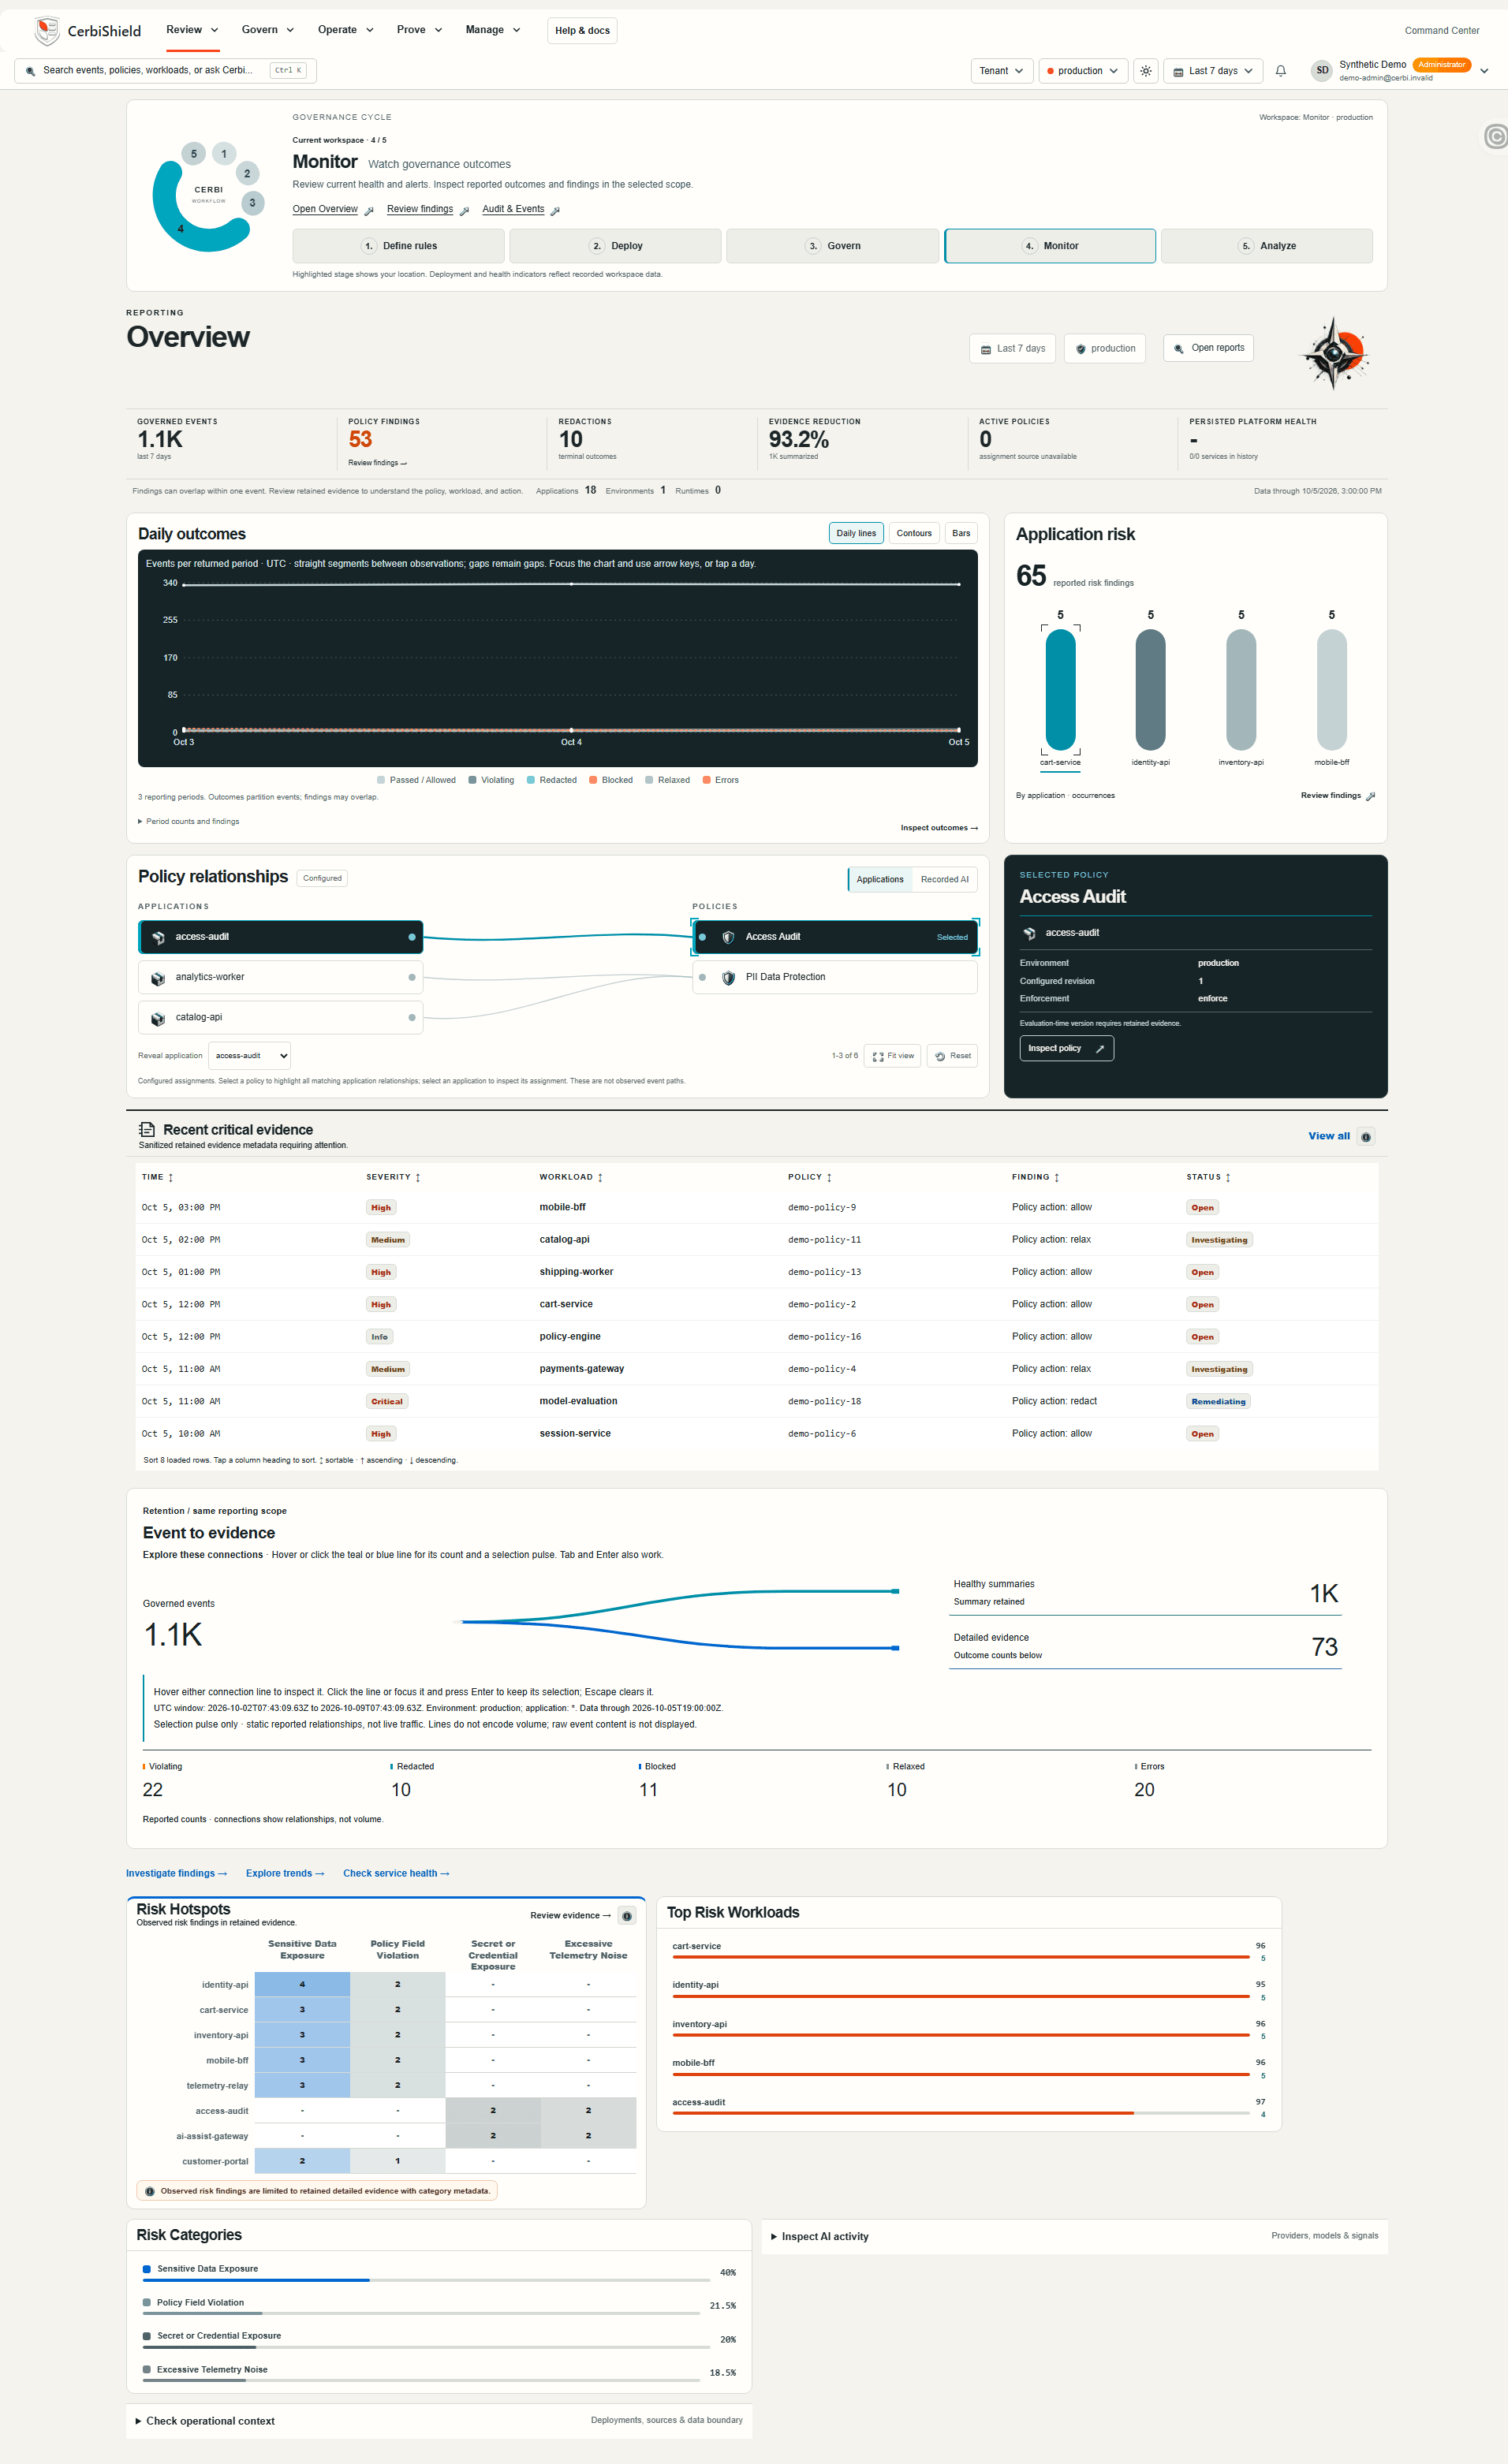
Actual CerbiShield Command Center UI with synthetic demo data. Review the selected scope and reporting window, then follow a finding into its application context.
Actual product UI · Illustrative demo data, not customer results. Scroll to inspect the complete capture.
What needs our attention?

Review the selected scope and reporting window, then follow a finding into its application context.

Explore the Command Center

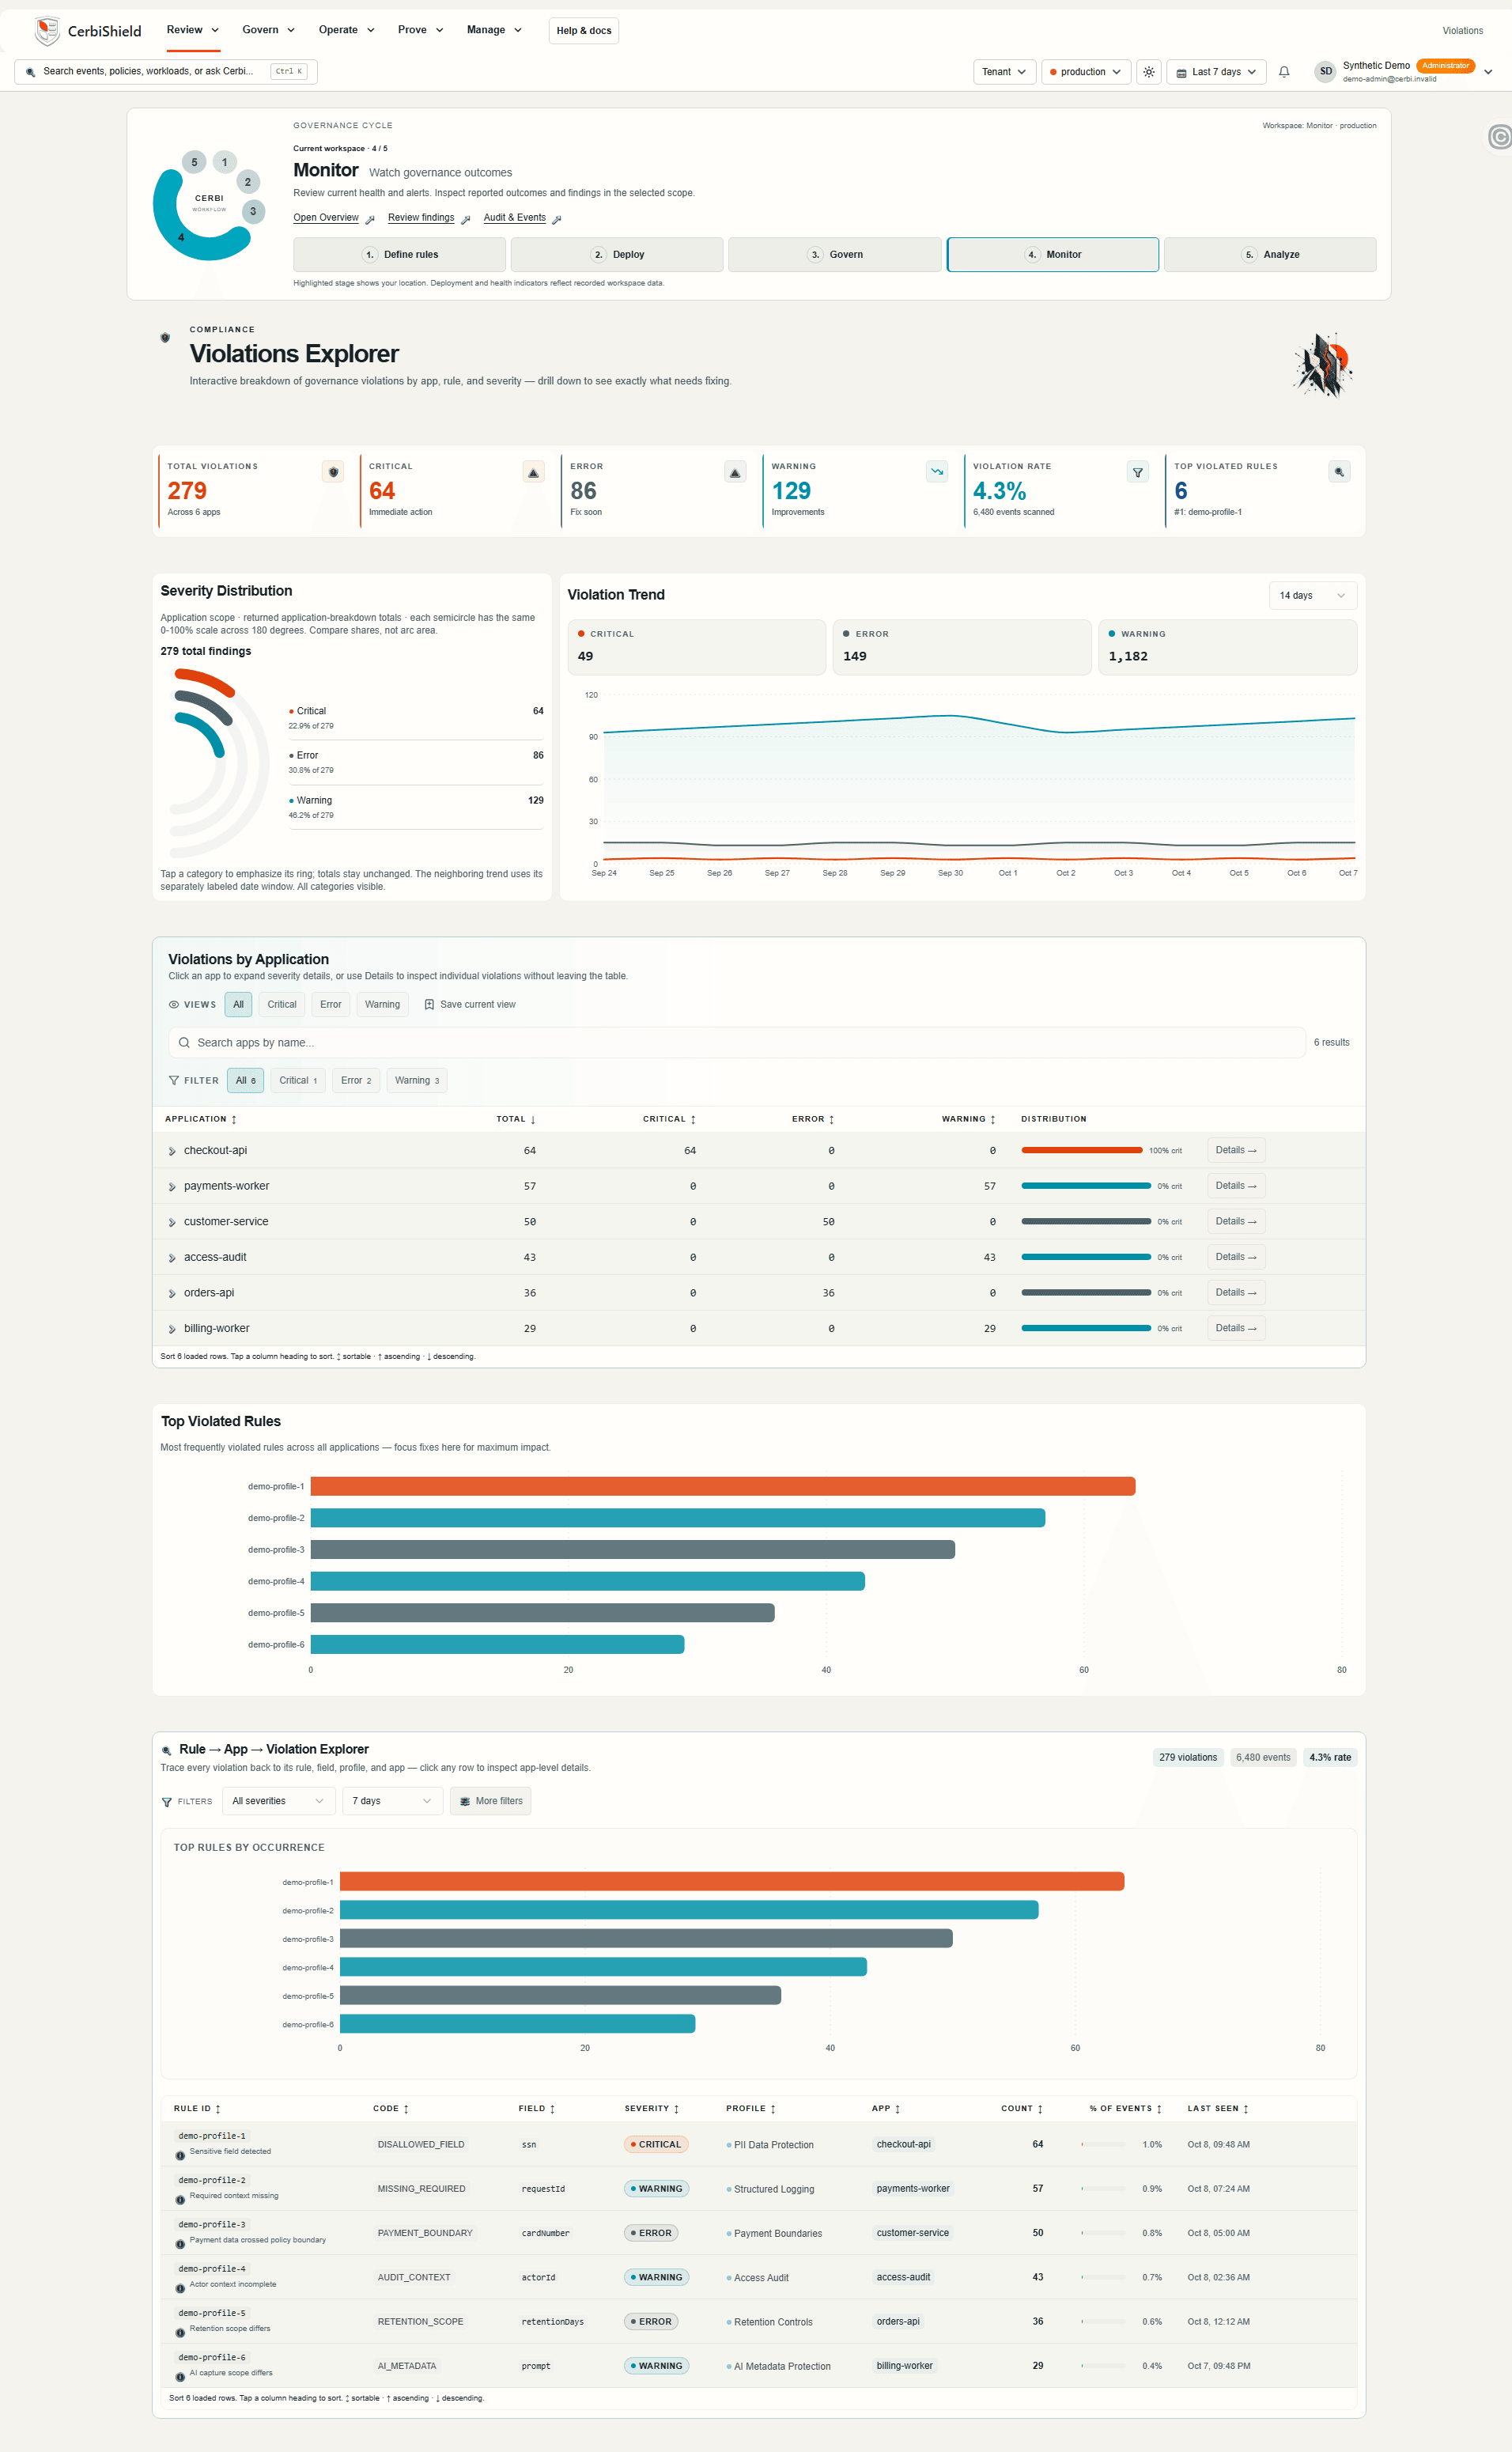
02 / Violations Explorer

Find the field. Focus the fix.

Move from severity patterns to the application, rule and field behind a finding. Give engineering teams specific evidence to investigate.

Violations ExplorerOpen full resolution
Actual CerbiShield Violations Explorer UI with synthetic demo data. Severity, application breakdowns and rule context help narrow the review. Counts retain their own labeled scope and time window.
Actual product UI · Illustrative demo data, not customer results. Scroll to inspect the complete capture.
Where should we investigate first?

Severity, application breakdowns and rule context help narrow the review. Counts retain their own labeled scope and time window.

Inspect application risk

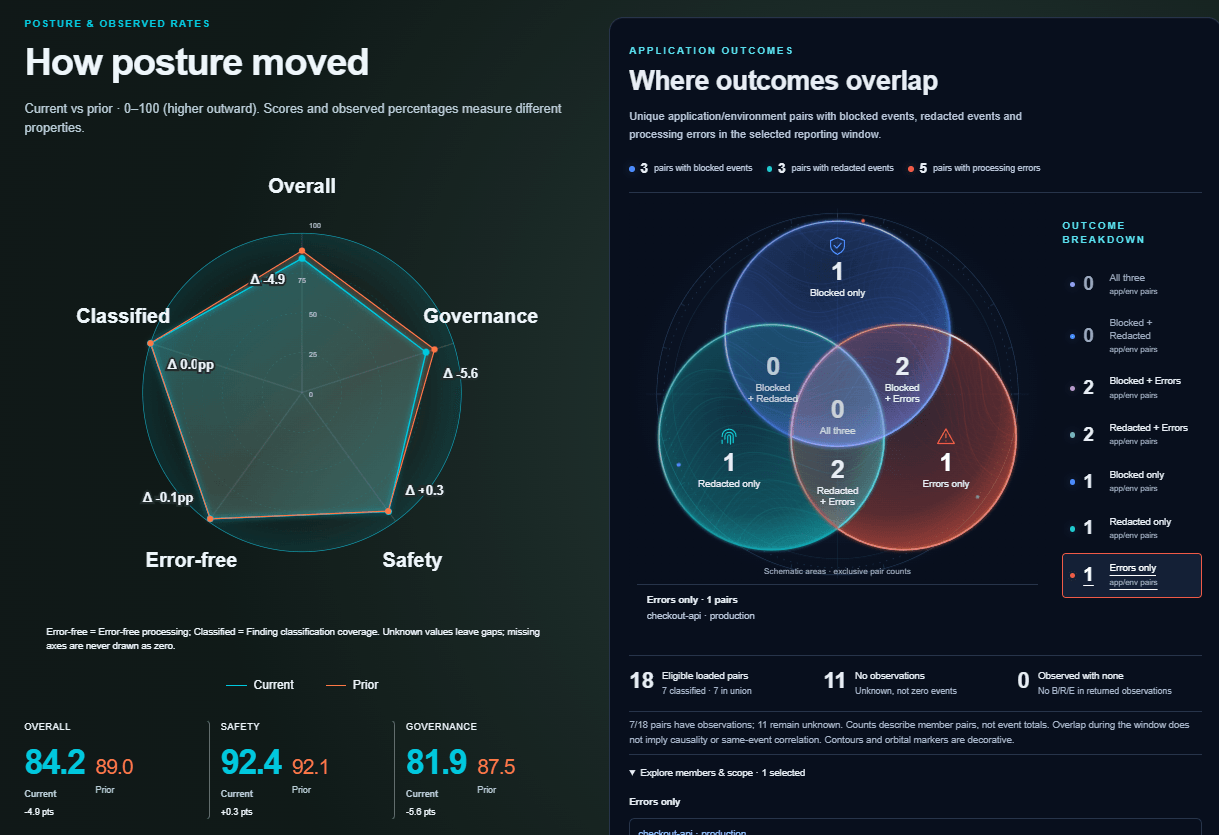
03 / Reporting

See the pattern behind the outcome.

Compare current and prior posture, then explore where blocked, redacted and error outcomes overlap. Turn a broad governance question into a focused review.

Actual CerbiShield Reporting UI with synthetic demo data. Overlap counts application/environment pairs, not event totals. Unknown observations remain unknown; the chart does not imply causality.
Actual product UI · Illustrative demo data, not customer results.
What changed, and where do outcomes overlap?

Overlap counts application/environment pairs, not event totals. Unknown observations remain unknown; the chart does not imply causality.

Explore posture and outcomes

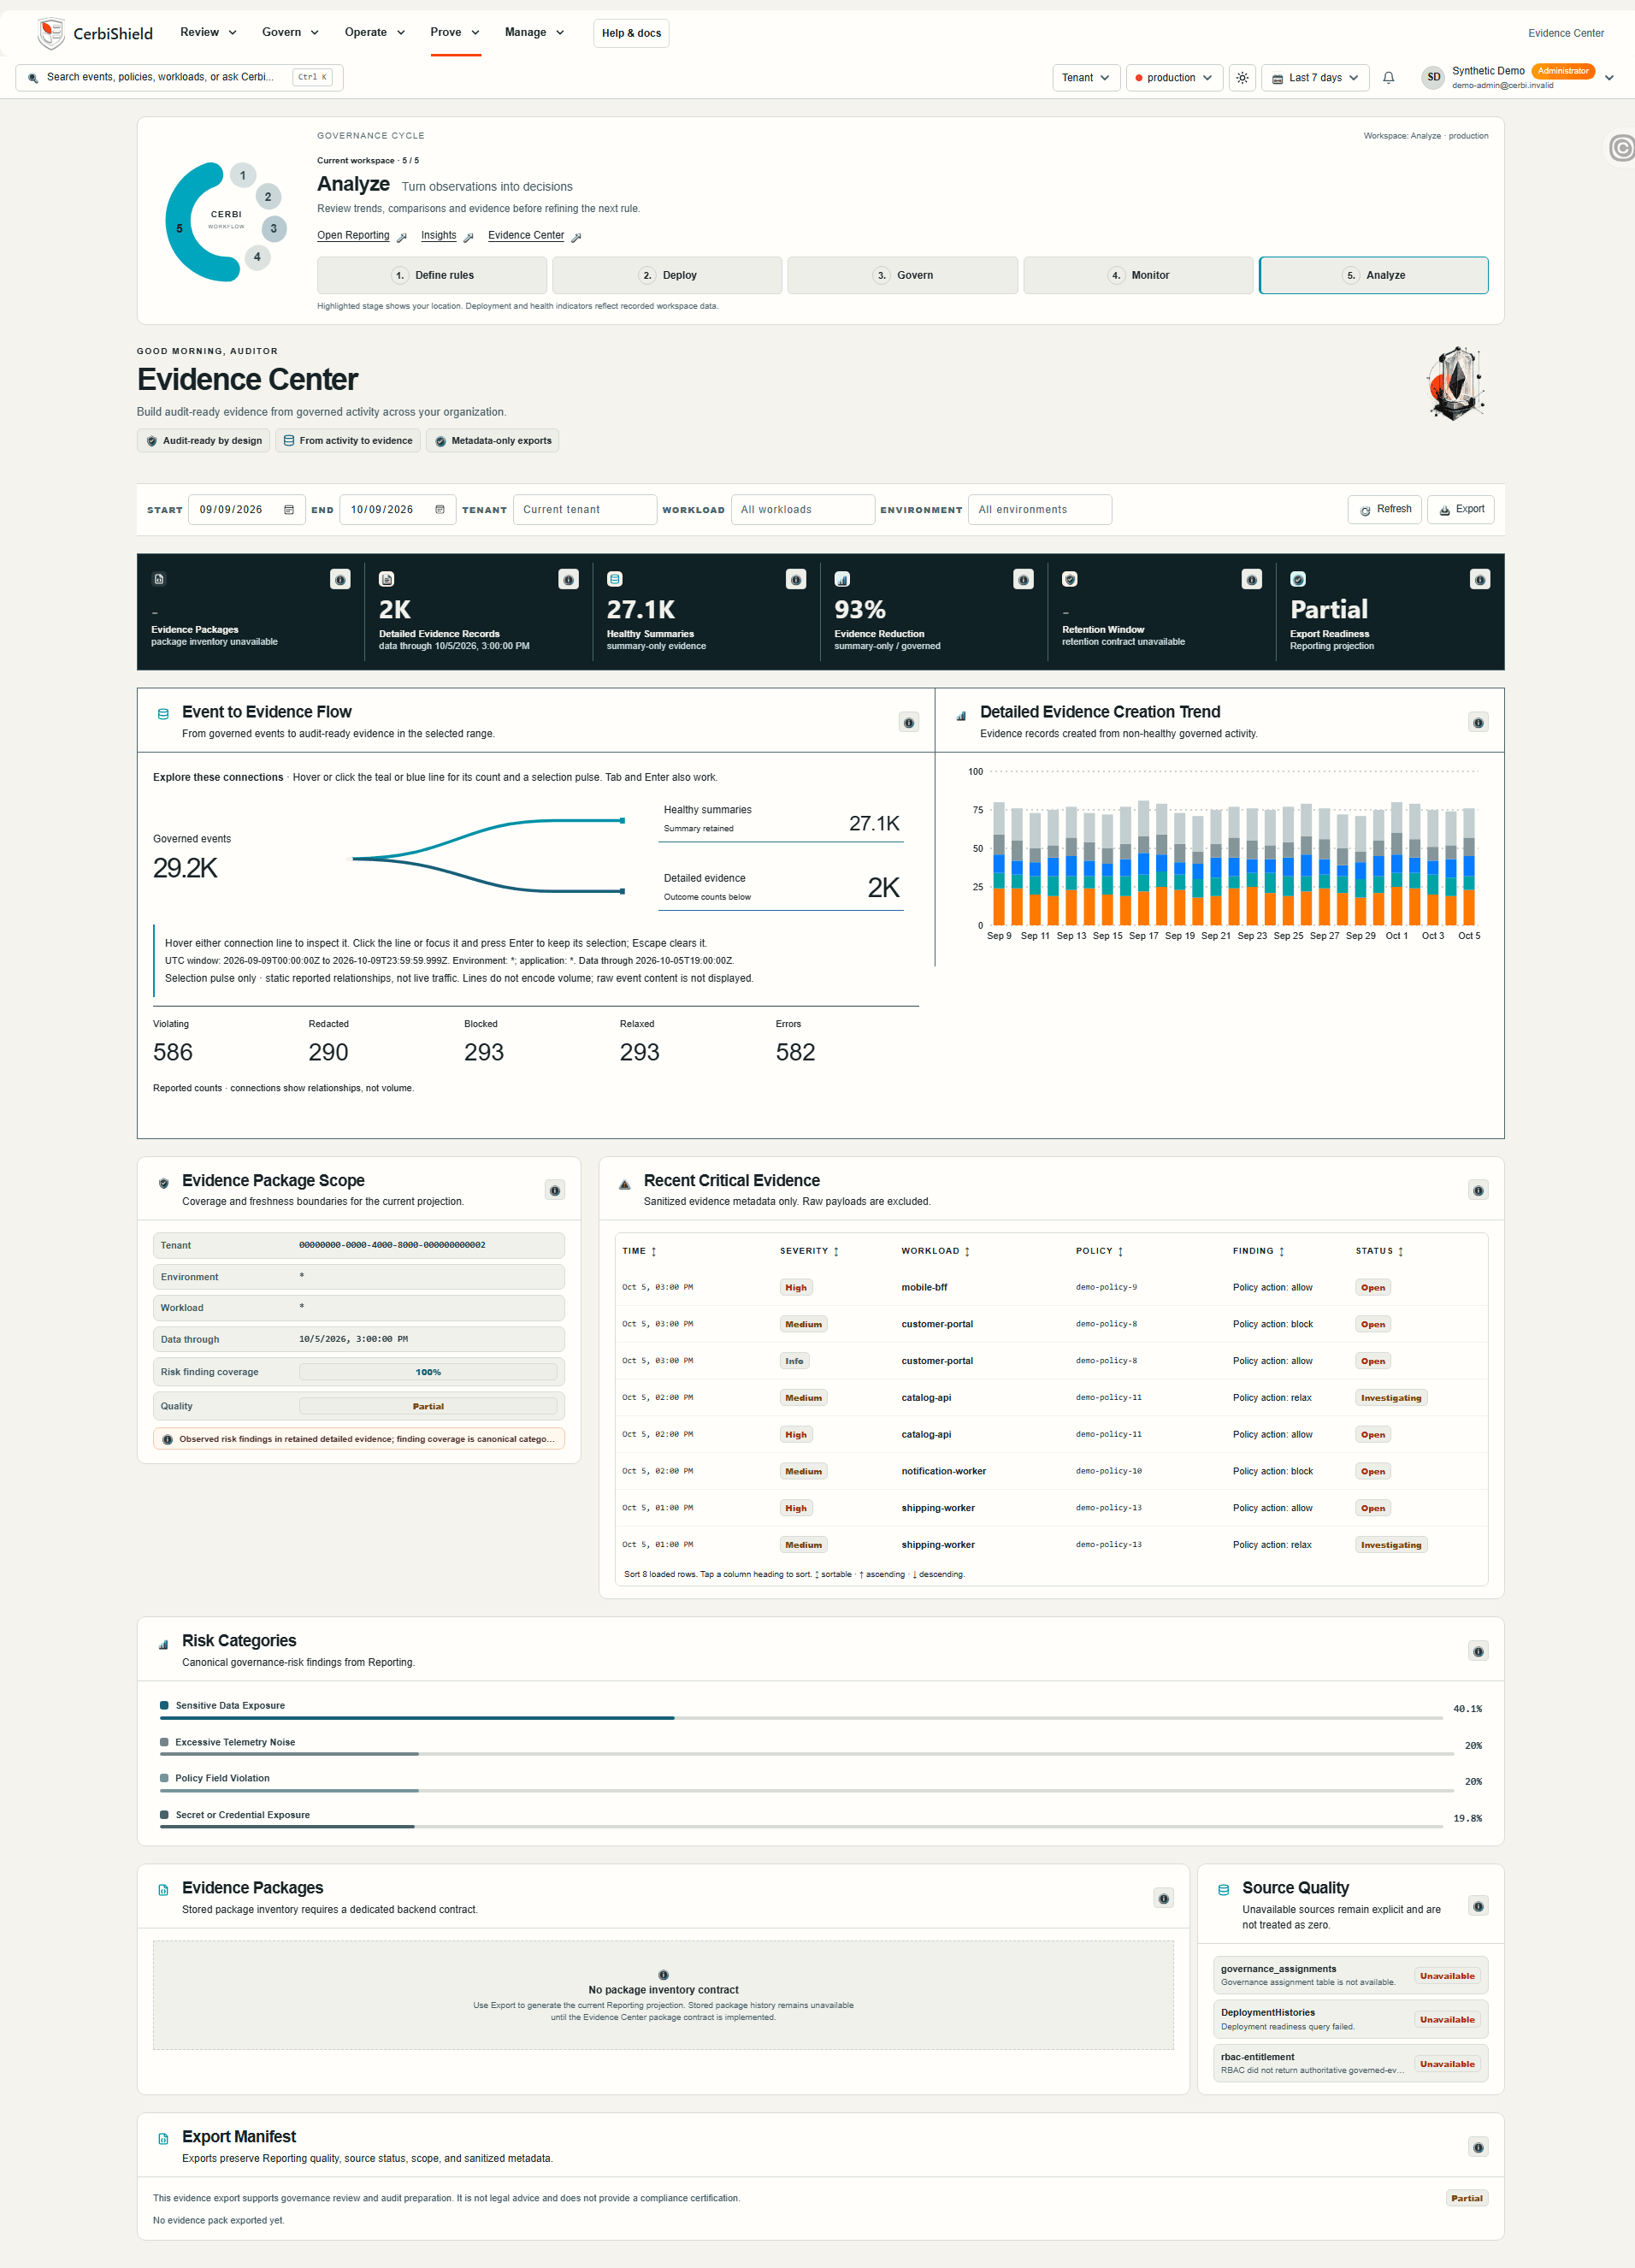
04 / Evidence Center

Keep the detail that explains it.

Connect governance summaries with retained evidence. Review what is available, its scope, and the source limitations that matter to the decision.

Actual CerbiShield Evidence Center UI with synthetic demo data. This demo shows a partial Reporting projection. Package inventory and retention sources are unavailable; those states remain visible in the capture.
Actual product UI · Illustrative demo data, not customer results. Scroll to inspect the complete capture.
What can we actually review?

This demo shows a partial Reporting projection. Package inventory and retention sources are unavailable; those states remain visible in the capture.

Follow retained evidence

Keep the stack.
Add the governance layer.

Your observability platform may already offer processing and redaction. Cerbi is relevant when a logging-control or evidence gap remains: inconsistent policy across teams, sensitive fields escaping controls, or no record of which policy governed a workload. Keep Splunk, Datadog, Azure Monitor, OpenTelemetry, and your existing destinations.

How Cerbi works / The governance path

Set the rules.Follow the outcome.

Create a policy, publish it to a target, and apply it at your configured logging integration. Review governance evidence in CerbiShield, then refine your rules.

Create rules, publish to a target, and apply loaded policy at a configured logging integration. Application logs enter runtime. Governance evidence goes to CerbiShield for review and rule refinement. Governed log output goes to configured destinations.

At your configured
logging integration.

Actions and evidence depend on the integration, policy, and reporting configuration. Verify runtime behavior after publication.

Read the process in plain text
  1. Create rules. Define your logging policy.
  2. Publish to target. Publish a policy version. Publication alone does not confirm that a runtime is using it.
  3. Apply loaded policy. Application logs pass through configured field rules at a supported logging integration.
  4. Review governance evidence in CerbiShield. Analyze recorded outcomes, then refine rules. Evidence depends on the reporting configuration.
  5. Send governed log output to configured destinations. The diagram describes connected logging paths, not every destination or telemetry source.

01One logging-governance lifecycle

Policy with a
runtime record.

For platform and security teams facing a customer-assurance or audit deadline: discover unsafe logging, define versioned policy, enforce it at supported boundaries, and prove what happened. Preserve useful debugging context where policy allows.

Discover → Define policy → Enforce → Prove

Enforce it.
Relax it deliberately.
Keep the evidence.

CerbiShield manages policy versions, rollout, observed coverage, and evidence over time. CerbiStream applies policy in selected applications; Gateway applies it on explicitly configured OTLP log paths. Available actions depend on the integration and policy.

Evaluate CerbiShield
PassedViolatingRedactedBlockedRelaxedError

One governed event, one terminal outcome. Findings are counted separately. Relaxed activity remains traceable.

A policy decision, up close

Keep the context.
Change the exposure.

Inspect the same fictional event before policy, with masking, and with an intentional developer override using Relax.

Illustrative policy example · synthetic fields.
Not a product screen or live evaluation.

application
checkout-example
operation
order.created
customer.email
[MASKED]
trace_id
example-trace-001

OutcomeRedacted

The configured masking rule protects the email field. Application, operation, and trace context remain useful for debugging.

.NETJava / Logback · Log4j2Node / Pino · WinstonGo / Zap · ZerologIntegration details

02Investigation + evidence

Follow the finding.
Keep the evidence.

Review findings alongside the application, environment, policy version, recorded outcome, and observation window where that context is available. Missing evidence cannot establish control coverage.

Application / Environment / Policy / Outcome / Evidence

See the application risk capture above, or open the complete investigation view in the dashboard tour.

03Reporting + audit

Governance you
can account for.

Bring policy outcomes, configuration changes, and authorization history into a reviewable evidence story.

Runtime evidence.
Operational context.
A record of change.

Reporting summarizes observed governance activity. Audit records help explain who changed configuration and when. Deployments and Service Health show the state of the governance plane itself.

Evidence supports governance reviews and audit readiness. It is not certification or a guarantee of regulatory compliance.

Explore reporting and evidence

04Governed Applications

Identity stays
with Entra.
Control lives with
the workload.

Register the application. Authorize the workload. Make access revocable and the lifecycle auditable.

  1. 01

    Register

    Create a stable, tenant-scoped governed application.

  2. 02

    Authorize

    Associate existing Entra workload principals; assign viewer or editor access.

  3. 03

    Govern

    Validate the workload token and active installation entitlement for governed access.

  4. 04

    Observe

    Read back governance profiles and review the recorded lifecycle.

  5. 05

    Revoke

    Revoke an assignment or disable the application; authorization fails closed.

  6. 06

    Audit

    Retain the authorization lifecycle, including changes and denials.

Microsoft Entra remains your identity authority. Cerbi validates real workload tokens and tenant-scoped assignments, backed by an active installation entitlement. Revocation and disablement invalidate authorization caches.

Explore workload authorization

05AI logging / Pro++ option

The same controls.
For AI-related logs.

AI-related logs can carry sensitive fields too. Apply the same logging-governance lifecycle to supported provider, model, agent, and tool metadata emitted through connected logging paths.

See the logged context

Systems, providers, models, dependencies, and agent/tool context where supported and emitted.

Inspect exposure and usage

Data classifications, protected-field evidence, request/token metadata, and estimated cost where supplied.

Keep policy evidence

Review recorded runtime outcomes. Raw prompts, responses, and secrets are not collected by default.

Explore AI logging scope
See the illustrative AI logging preview

Visibility depends on instrumentation and emitted log metadata. This does not authorize agent actions, govern model behavior, or provide universal AI estate coverage.

Graphite planes meet a precise teal glass boundary against an open ivory field.
Boundary study / Cerbi editorial artwork

Customer-hosted architecture

Your Azure tenant.
Your operating boundary.

CerbiShield deploys as an Azure Managed Application into the customer’s tenant. Managed identities, server-side tenant isolation, and governed access support architectural control.

Customer tenant

Microsoft Entra

Managed Identity

Azure Managed Application

Customer-controlled infrastructure

Policy, deployment, service health, and evidence in the customer’s operating environment.

Build-time signal + runtime evidence

Find the gap before it ships.

Run the free Scanner independently. Review findings against your existing controls; if a recurring gap remains, evaluate CerbiShield on one workload with an agreed policy and evidence requirement.

A founder-led logging-risk review

Find the control gap.
Test one workload.

Bring a Scanner finding, a sensitive-field concern, or an evidence requirement. Compare existing controls first. If a gap remains, agree one workload, one policy, an evaluation window, and evidence to review before deciding on a recurring CerbiShield deployment.

Why governance evidence matters

As AI systems take more actions across enterprise applications, teams need evidence of what happened and how policies were applied. Cerbi helps engineering teams govern application telemetry and review recorded policy outcomes, alongside their existing security and observability tools.

Industry context: OpenAI’s report on the Hugging Face incident and model misalignment.

Cerbi | Customer-Hosted Application Logging Governance